
 On May 17th of this year I posted the article “Emergency Response Guidebook 2012 Summary of Changes (April 2012)” pointing out some of the changes and upgrades to the 2012 edition of the DOT ERG. If your business handles Ammonia (UN1005), Chlorine (UN1017), Ethylene oxide (UN1040), Hydrogen chloride (UN1050) and Hydrogen chloride, refrigerated liquid (UN2186), Hydrogen fluoride (UN1052), Sulfur dioxide/Sulphur dioxide (UN1079) you will be thrilled at the advancements of the 2012 DOT ERG (pdf). The new table “TABLE 3 – INITIAL ISOLATION AND PROTECTIVE ACTION DISTANCES FOR DIFFERENT QUANTITIES OF SIX COMMON TIH GASES” is actually six new tables covering these six “Toxic Inhalation Hazard” materials. At first glance many users may not notice some of the changes to the 2012 edition, as the “official list of changes” from PHMSA apparently did NOT list every single change in 2012. Some will call the changes “needed” and some may call the changes “dangerous”; I will leave that up to the reader. But there are a few changes that I have come across as I used the 2012 edition in the past few weeks that may be of use to you and your facility, and at least need to be pointed out.
Now I specialize in Ammonia, Chlorine, Hydrogen Chloride, and Flammable Liquids and Gases in the vast amount of my emergency response and industrial safety work, so I have closely examined the differences in these three specific Toxic Inhalation Hazard (TIH) chemicals (not so on all the flammables). Here is what I have found:
Ammonia
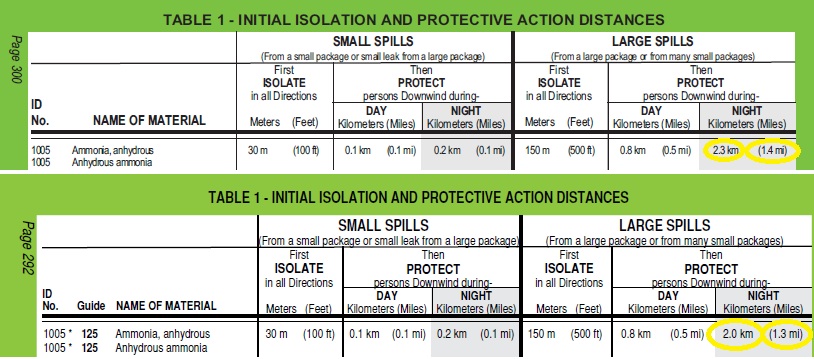
The top graphic is the 2008 Table 1 Distances and the bottom graphic is the new 2012 Table 1. Notice the slight differences in Distances for the Large Spill @ Night.
Chlorine
The top graphic is the 2008 Table 1 Distances and the bottom graphic is the new 2012 Table 1. Notice the slight differences in Distances for the Large Spill @ Night.

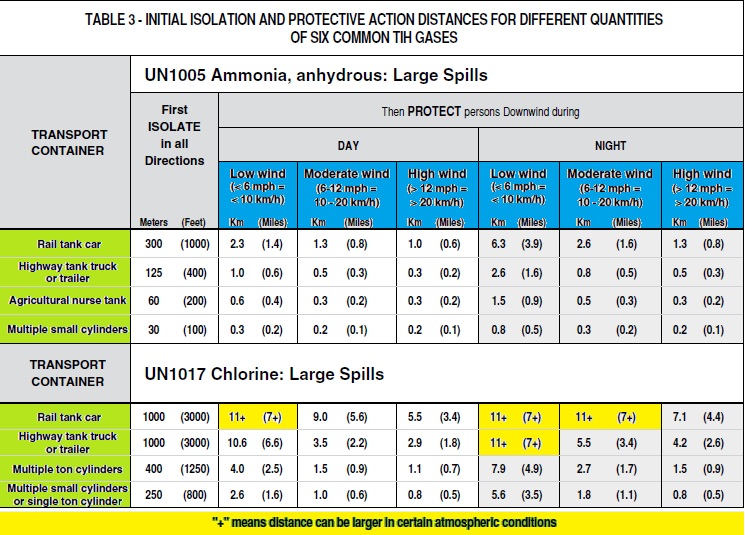
But the BIGGEST improvements are the addition of Table 3 – INITIAL ISOLATION AND PROTECTIVE ACTION DISTANCES FOR DIFFERENT QUANTITIES OF SIX COMMON TIH GASES. This new table takes these six (6) common Toxic Inhalation Hazard (TIH/PIH) Chemicals and breaks down their INITIAL ISOLATION DISTANCES and their PROTECTIVE ACTION DISTANCES by the container involved in the release, as well as the wind speed!! This is MUCH more specific data than just the Table 1 data as shown above. Here are the two tables for Ammonia and Chlorine and I have highlighted the different sections so that it is apparent:
I have written before explaining the differences from DAY to NIGHT distances in these tables, but I am still amazed at the number of emergency responders who have no actual clue for the differences. It is NOT based on the fact that people are at home and a sleep at night!!!! I would love to find the trainer who started this myth and put this crazy notion to rest one day, but until then REMEMBER this… it is ALL due to atmospheric conditions and NOT our bedtimes! With that said, pay close attention to the distances based on the differing wind speeds. Those of us involved in our facility’s Risk Management Plan Off-site Consequence Analysis (OCA) know that a slow wind speed is MUCH worse that a high wind speed. This is merely because a low wind speed (e.g. defined as <6 mph in these tables) will NOT disperse the cloud, but will push the cloud in a higher concentrated condition further distances; where as a higher wind speed (e.g. defined as >12 mph in these tables) will disperse the cloud, thus reducing its concentration more effectively. Granted, a higher wind speed can result in the material traveling a greater distance, but it will be in a much less concentrated form- so we may get odor complaints and exposure complaints much further downwind with a higher wind speed, but the exposures will be less harmful (notice I said “less harmful”, this is not to imply “no harm”). Just like EPA used the Emergency Response Planning Guide 2 (ERPG-2) in their OCA determination of “end points”, the DOT ERG uses the same end points in their modeling. (See my previous article on what the ERPGs mean) The other factor that becomes apparent in the comparison of these two materials is their vapor density. Ammonia has a VD<1 and Chlorine has a VD>2, thus look at the vast differences between the two in their Initial Isolation and Protective Distances. Take note that during DAYLIGHT hours, a SINGLE 1-Ton CL2 cylinder (i.e., 2,000 pounds) will put 3ppm (i.e. ERPG-2 concentrations) of Chlorine downwind at distances further than a railcar containing around 170,000 pounds of Anhydrous Ammonia can put downwind at ERPG-2 concentrations (150 ppm). Only with a settling atmosphere at NIGHT, will a Railcar of Anhydrous Ammonia put 150 ppm downwind at distances further than a 1-ton cylinder of chlorine! Again the big driver of this is the fact that Chlorine is 2X heavier than air, so it will behave similarly during the day or night; but Ammonia’s Vapor Density is less than 1, so it wants to rise during the day, but during the night with a settling atmosphere, ammonia will tend to remain down closer to the ground, thus the ERPG-2 distance is expanded at night time.
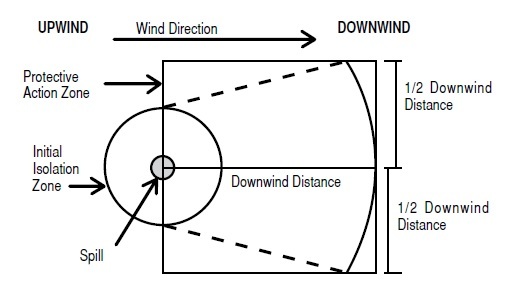
Lastly, I want to remind everyone reading this that these DOWN WIND distances MUST also include the “Protective Action Zone” as shown below. This means we have to move laterally off the center line (representing the down wind distance) by a factor of 1/2 of the downwind distance to build our Protective Action Zone box.
Now in the graphic below I have shown the distances, using Table 3 above for a 1-ton CL2 cylinder during the day with a Low Wind Speed (<6 mph).
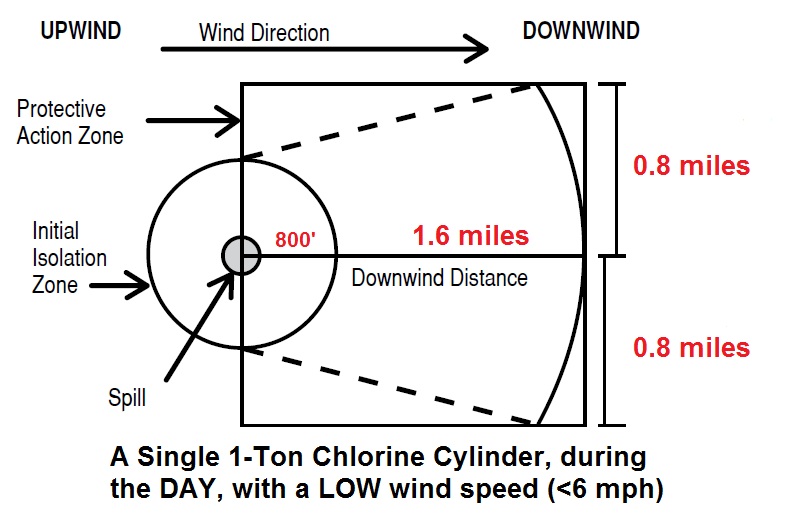
Now if you want to take this to the next level and do a little “pre-planning” for your facility, I’d suggest we use either a very detailed modeling software such as one of my favorites FiRST from ARA or we can always fall back on ole reliable CAMEO/ALOHA/MARPLOT package (which has actually come a long ways since it’s release 20 + years ago). Since CAMEO/ALOHA/MARPLO is free and I would not be violating any copy rights of ARA I will provide an image of what the above model would look like in MARPLOT using it’s Satellite images. I used my address in Milford, OH to model this. My neighbors would love me if I stored a one-ton cylinder of Chlorine at my house!!!! The large yellow circle shows the 1.6 miles distance in all directions and the smaller yellow lines radiating out from the center shows the release occurring with the wind directly out of the East. The Center yellow line is 1.6 miles and the yellow lines extending North and South are 0.8 miles (see the graphic above for where these numbers came from).
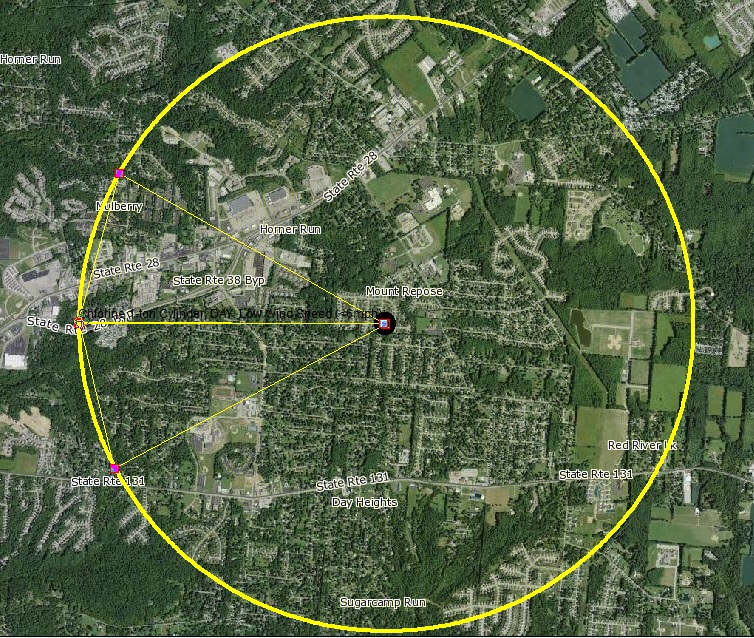
Doing this model took me all of 5 minutes to plot! Do you want to get your management team’s attention regarding the hazards of your facility? Ask them to provide you some likely scenarios they feel could have an off-site impact and then go back and model them using this FREE software. You may be surprised yourself as to the off-site impact your facility may have. The 1-ton cylinder release at my house just misses I-275 (the interstate loop around Cincinnati) by several hundred feet!!! If you download all of your tiger files, you can even click inside your impact zone and get the population within your zone. My release has the potential to impact over 14,000 people. One interesting thing I like to look at is the square miles impacted within my scenario, this one was just over 8 square miles (e.g. the 360° foot print).
If you have an interest in doing some detailed “Emergency Response Pre Planning” and would like to discuss having me assist you in this effort, please contact me. If you’d have an interest in learning how to do this on your own AND enough people express the interest I will add this to my list of 2013 Training Courses.