
Ammonia Incidents in Oregon
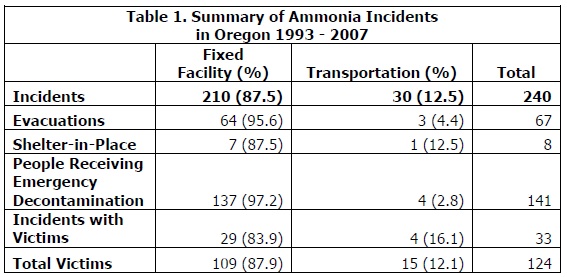
From 1993 – 2007 ORHSEES recorded a total of 3,187 qualifying chemical incidents in Oregon. Of these qualifying incidents, 240 (7.5%) involved a release of ammonia. 87.5% of the ammonia releases occurred at fixed facilities while 12.5% occurred during the transport of ammonia. A total of 67 of the 240 ammonia incidents required an evacuation order, affecting 3687 people. Evacuations ranged from one person to 500 people. Eight incidents called for a shelter-in-place order. There were 33 incidents involving injuries, with a total of 124 victims, an average of 3.8 victims per incident. There were a total of 141 individuals who received emergency decontamination, including emergency personnel, employees, and members of the general public during the 240 incidents.
Victims of Ammonia Incidents
The vast majority of victims were employees of the industry that experienced the ammonia release, representing 83% of those injured. The general public was the next most common group to suffer an injury due to an ammonia incident (13% of victims) followed by responders representing 4% of victims (Fig. 1)
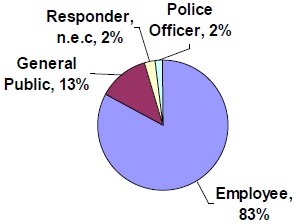
Fig 1. Persons injured in ammonia incidents in Oregon, 1993 – 2007 by classification
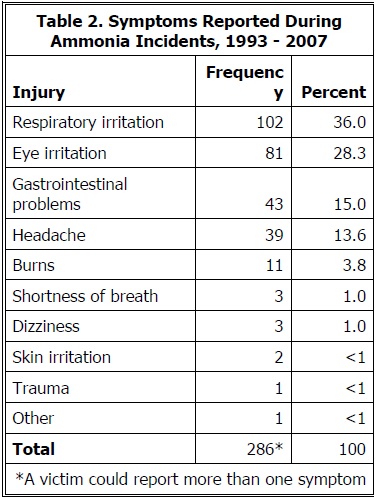
During these 240 ammonia incidents, 36% of victims reported suffering respiratory distress and 28% reported eye irritation (Table 2). Other common symptoms were nausea and vomiting (15%) and headache (14%). There was an average of 2.3 symptoms per victim. 34% of victims reported one or two symptoms while 32% reported 3 or more symptoms related to their exposure to the incident.
Affected Industries
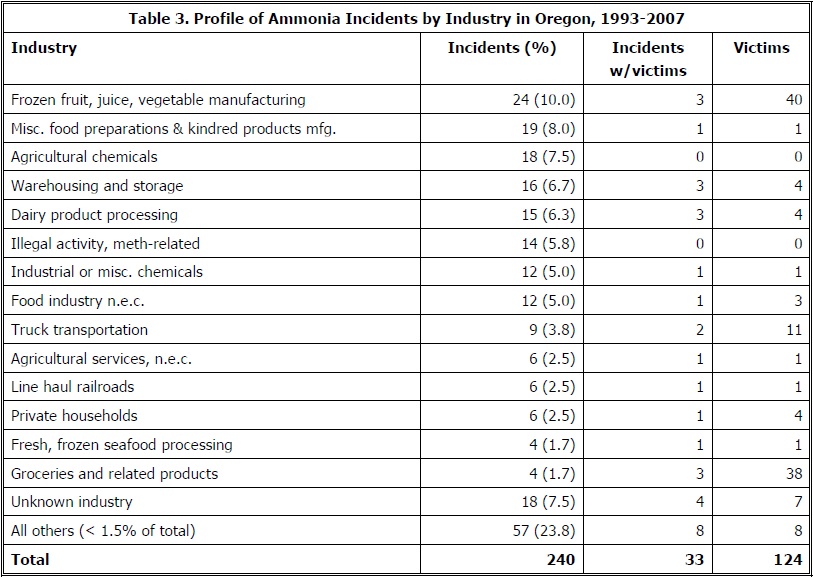
The most common industries where ammonia release incidents occurred were manufacturing industries: frozen fruit, juice, and vegetable manufacturing (24, 10%), followed by misc. food prep and kindred products (19, 8.0%) and agricultural chemical manufacturing (18, 7.5%) (Table 3). Warehousing and storage had 16 events (6.7%) while dairy products processing had 15 events (6.3%). There were 18 events which had no or unknown industry information. For the 33 events that reported victims, the most common industries were frozen fruit, juice, vegetable manufacturing (3 events with 40 victims), and groceries and related products (3 events with 38 victims). Factors contributing to the incident are important indicators that can help inform future prevention and mitigation efforts. Information on contributing factors was not available during the entire time period of this analysis; 1996 is the first full year with data on contributing factors. For the 180 ammonia events that had data for contributing factors, the most common primary factor was equipment failure (95, 52.8%), followed by human error (30, 16.7%) intentional or illegal act (30, 16.7%), and other (25, 13.9%).
Click Here to download the entire report (pdf)