The information in this report was collected by staff in the North Carolina Hazardous Substances Emergency Events Surveillance (HSEES) Program. Ammonia releases in North Carolina have resulted in injuries, hospitalizations, and workplace evacuations. Some examples of ammonia releases in NC include:
1) After exposure to industrial strength ammonia cleaner fumes, two clothing store employees suffered nausea, skin irritation, and dizziness. They were transported to a hospital for observation.
2) An ammonia cylinder ruptured at a distribution facility releasing 60 pounds. One worker was treated at the scene for respiratory irritation, and 4 volunteer firefighters were transported to a nearby hospital and treated for respiratory irritation.
3) A chemical reaction of ammonia and solid cake deodorizer in a porta-john caused an emission of vapors. The area was sealed until the vapors dissipated. One person was treated and released from the hospital for respiratory and eye irritation.
4) A poultry-processing plant was evacuated after 100 pounds of ammonia was released from a plate chiller due to a malfunctioning relief valve. Seventeen employees were transported to the hospital for observation due to respiratory irritation.
5) Ninety-six pounds of anhydrous ammonia were released when a liquid-to-vapor crossover line on a 20,000-gallon tank was accidentally opened. Two workers complaining of respiratory irritation were evaluated at a hospital.
Of the 82 ammonia releases that occurred between 1993-1997 in North Carolina, 77 (93.9%) occurred in fixed facilities and 5 (6.1%) took place in transit.
Most of the fixed-facility spills resulted from unintended releases from process vessels (N = 21, 26.5%), piping (N = 18, 22.8%), and storage above-ground (N = 12, 15.2%).
Efforts to identify the factors contributing to chemical releases were initiated in 1995. Of the 45 ammonia events that occurred from mid-1995 to 1997, 31 (68.9%) were caused by equipment failure. Operator error was cited as the major contributing factor in another 7 (15.6%) incidents.
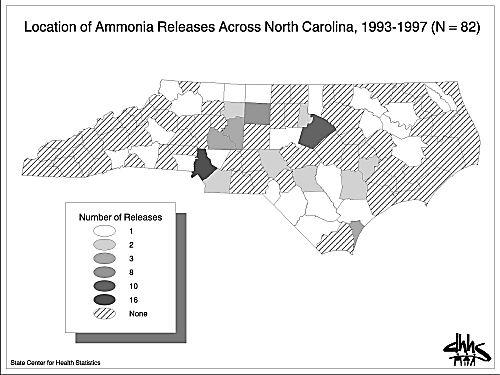
These events are summarized in Table 1. Table 2 lists the types of industries involved in ammonia releases. Locations of ammonia releases are shown in Map 1.
|
||||||||||||||||||||||||||||||||||||||||||||||||||||||||||||||||||||||||||||||||||||
| Type of NC Industry Releasing Ammonia | No. of Events |
|---|---|
| Meat products | 15 |
| Drugs, chemicals, and allied products | 7 |
| Railroads | 7 |
| Groceries and related products | 6 |
| Warehousing and storage | 6 |
| Dairy products | 5 |
| Industrial and miscellaneous chemicals | 5 |
| Trucking service | 5 |
| Beverage industries | 3 |
| Other | 23 |