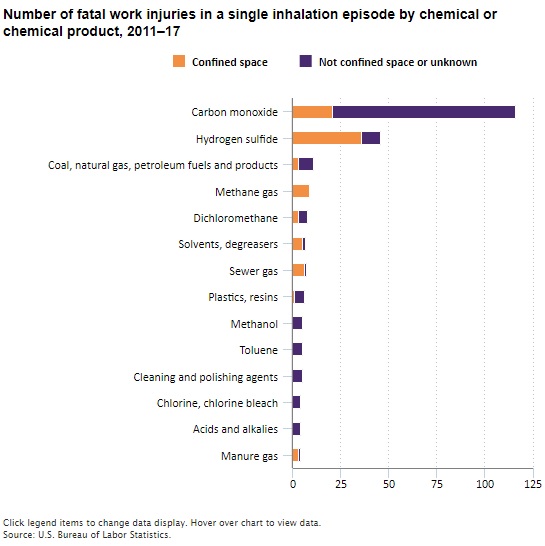
 I use this graph in my PRCS training and it always seems to get a lot of discussions, so I thought I would share it here. SAFTENG members can download my training materials from the Member’s Area “Document Library. But this particular graph shows us the Number of fatalities from 2011-2017 from a single inhalation episode by chemical and if this event occurred inside a PRCS or not – QUITE TELLING…
NOTE: Fatal occupational injuries involving confined spaces rose 15% in 2017!!!!
Non-members may find and compile this data @ BLS.gov

