Here are the official numbers from The Chlorine Institute:
| Chlorine Releases North American Chlor-Alkali Manufacturing Facilities 1997-2014 |
||||
| Year | Number of Releases |
Total Amount Released (Lb.) |
Average Released (Lb.) |
Median Released (Lb.) |
| 1997 | 17 | 2,715 | 160 | 33 |
| 1998 | 22 | 1,051 | 48 | 28 |
| 1999 | 20 | 4,449 | 222 | 19 |
| 2000 | 19 | 2,617 | 138 | 31 |
| 2001 | 9 | 864 | 83 | 83 |
| 2002 | 9 | 592 | 65 | 36 |
| 2003 | 11 | 898 | 82 | 67 |
| 2004 | 10 | 1,073 | 107 | 48 |
| 2005 | 8 | 2,144 | 268 | 96 |
| 2006 | 8 | 774 | 97 | 60 |
| 2007 | 5 | 4,893 | 979 | 30 |
| 2008 | 5 | 198 | 40 | 48 |
| 2009 | 6 | 431 | 72 | 54 |
| 2010 | 6 | 604 | 101 | 69 |
| 2011 | 6 | 275 | 69 | 88 |
| 2012 | 4 | 299 | 75 | 47 |
| 2013 | 1 | 162 | 162 | 162 |
| 2014 | 13 | 15,393 | 1,184 | 61 |
| TOTALS | 179 | 39,432 | – | – |
| Average per Year | 10 | 2,190 | ||
In the year 2006, MX and CN facilities began reporting their incident to the CI
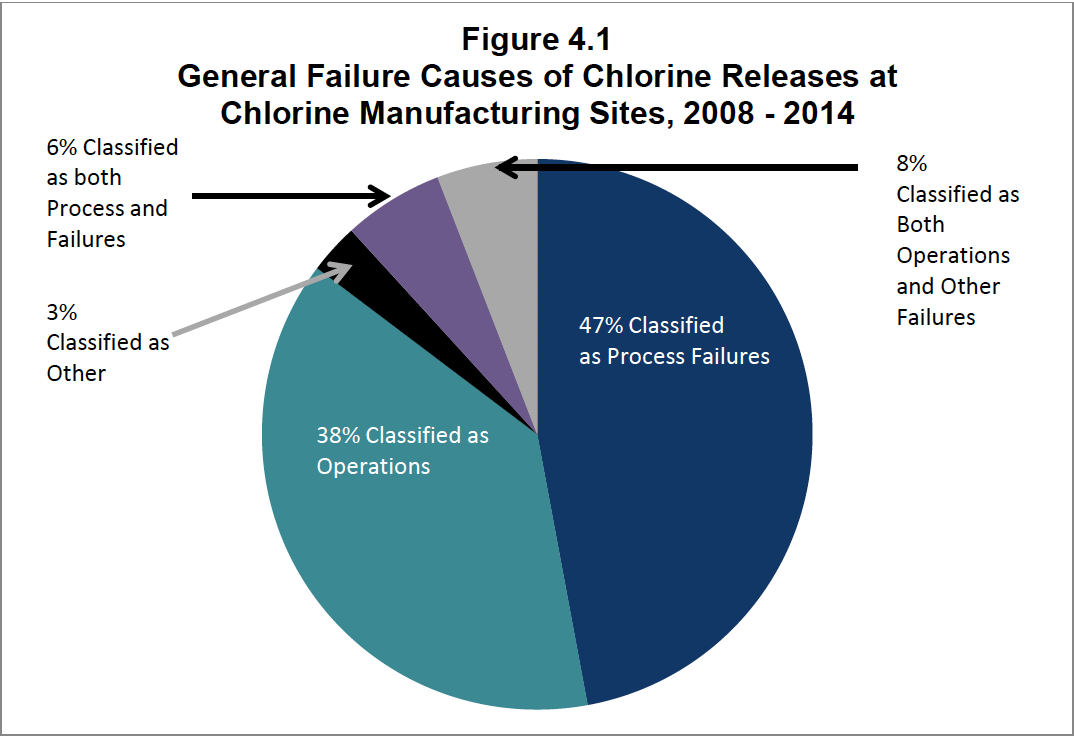
The releases were broadly categorized as process failures and operations failures. Process failures, in this context, are defined as mechanical integrity deficiencies, hazard analysis deficiencies and general equipment failures. Operations failures, in this context, as defined as failures relating to human interaction, including training deficiencies, deviation from procedures, deficient procedures, and/or management of change deficiencies.