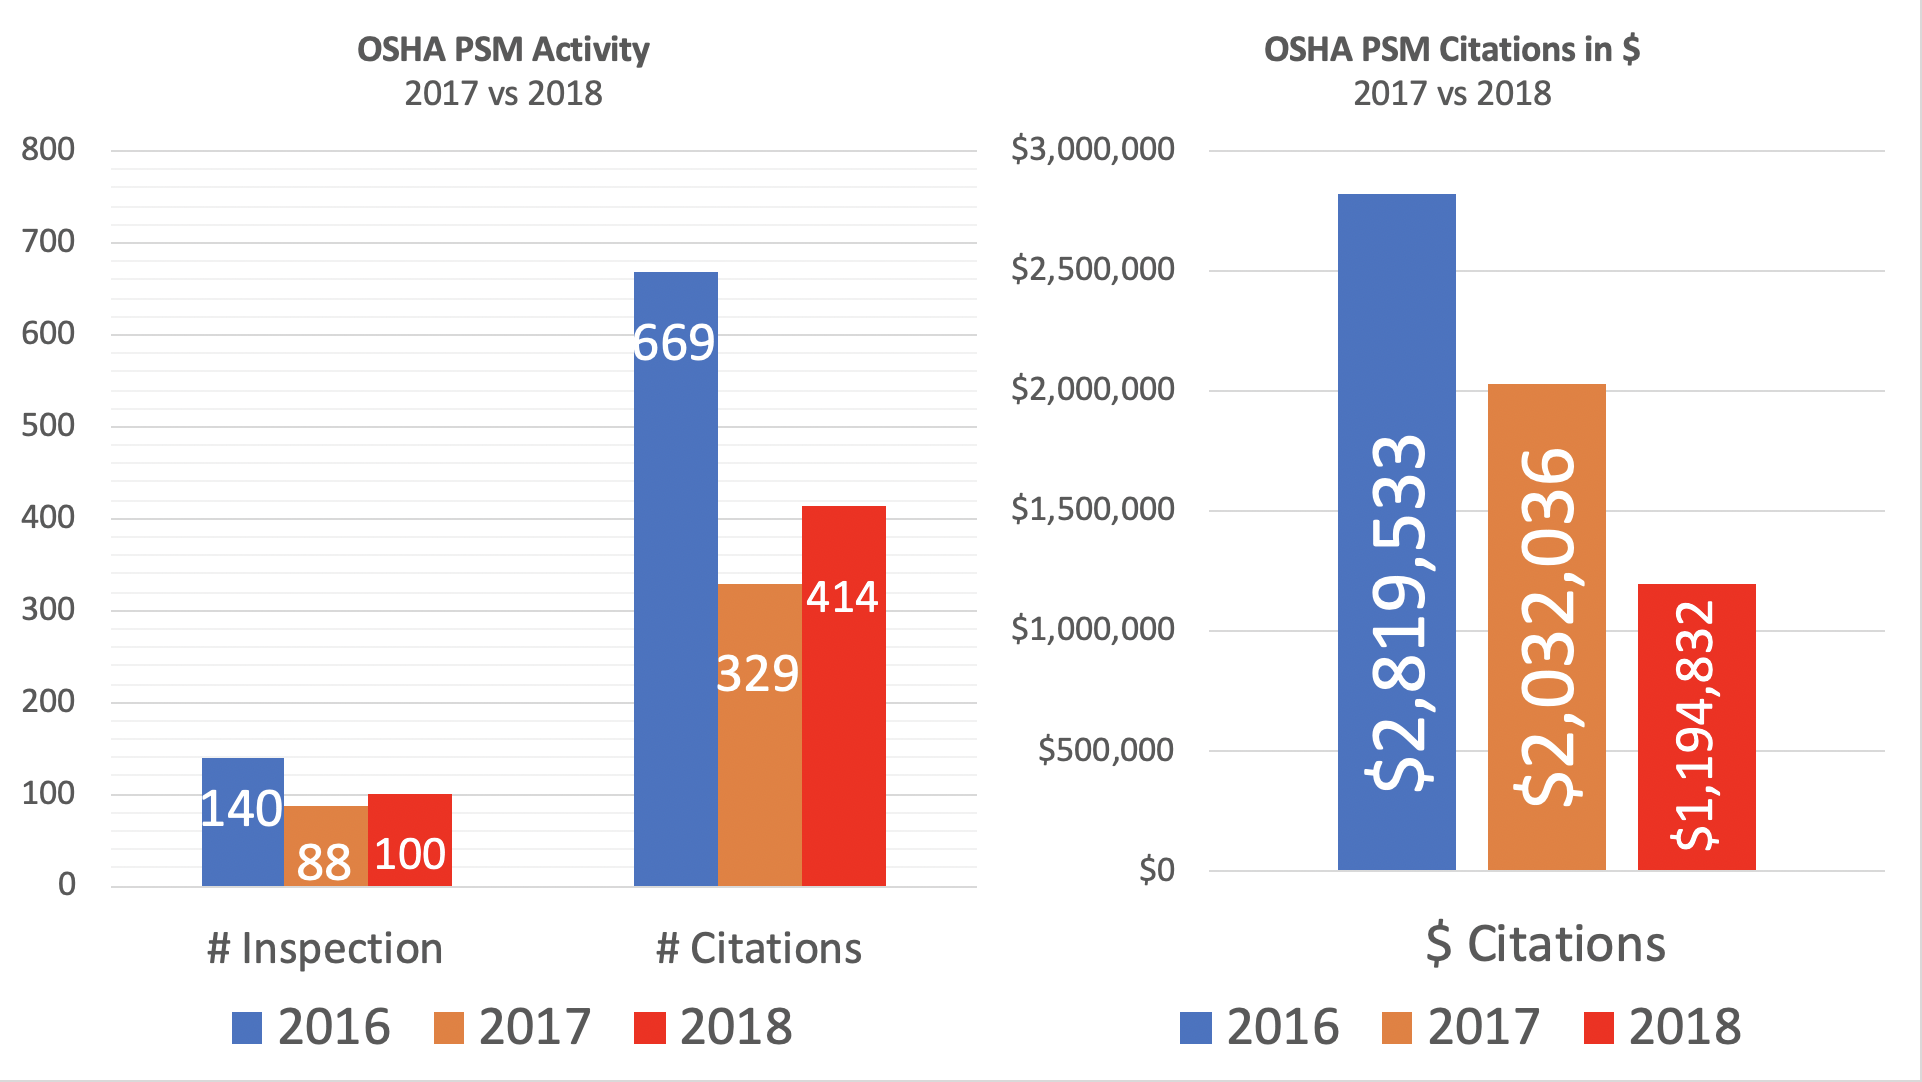
I received a number of requests today regarding questions about the 2018 PSM Inspection Data I posted last night. Mostly, members wanted to see a comparison to previous years data. So here is the comparison of charts/graphs for the SAFTENG members that include 2016, 2017 and 2018 data for
- # of Inspections,
- # of Citations, and
- the Citation $
This is nothing fancy, but quite telling:
- 2018 saw an increase in 2 of 3 categories analyzed from 2017 to 2018, but when compared to 2016, both 2017 and 2018 were off about 50%!
- We saw a STEEP DECLINE in 1 category that I analyzed and it was a decrease of 51% from 2016 to 2017 and then a slight rebound in 2018 of 26% Increase
- 1 category held relatively steady, seeing a 37% decrease from 2016 to 2017, but an increase of 13% in 2018 from 2017
- BOTTOM LINE… 2016 was the year with the most inspections, most citations, and most $’s in fines!
What say you?

